Sales dashboard
The vending sales analytics screen: device behaviour by account and period.
Vending only
The dashboard aggregates only vending-line deliveries. If your operator does not handle vending, the section does not appear in the menu. See Business lines.
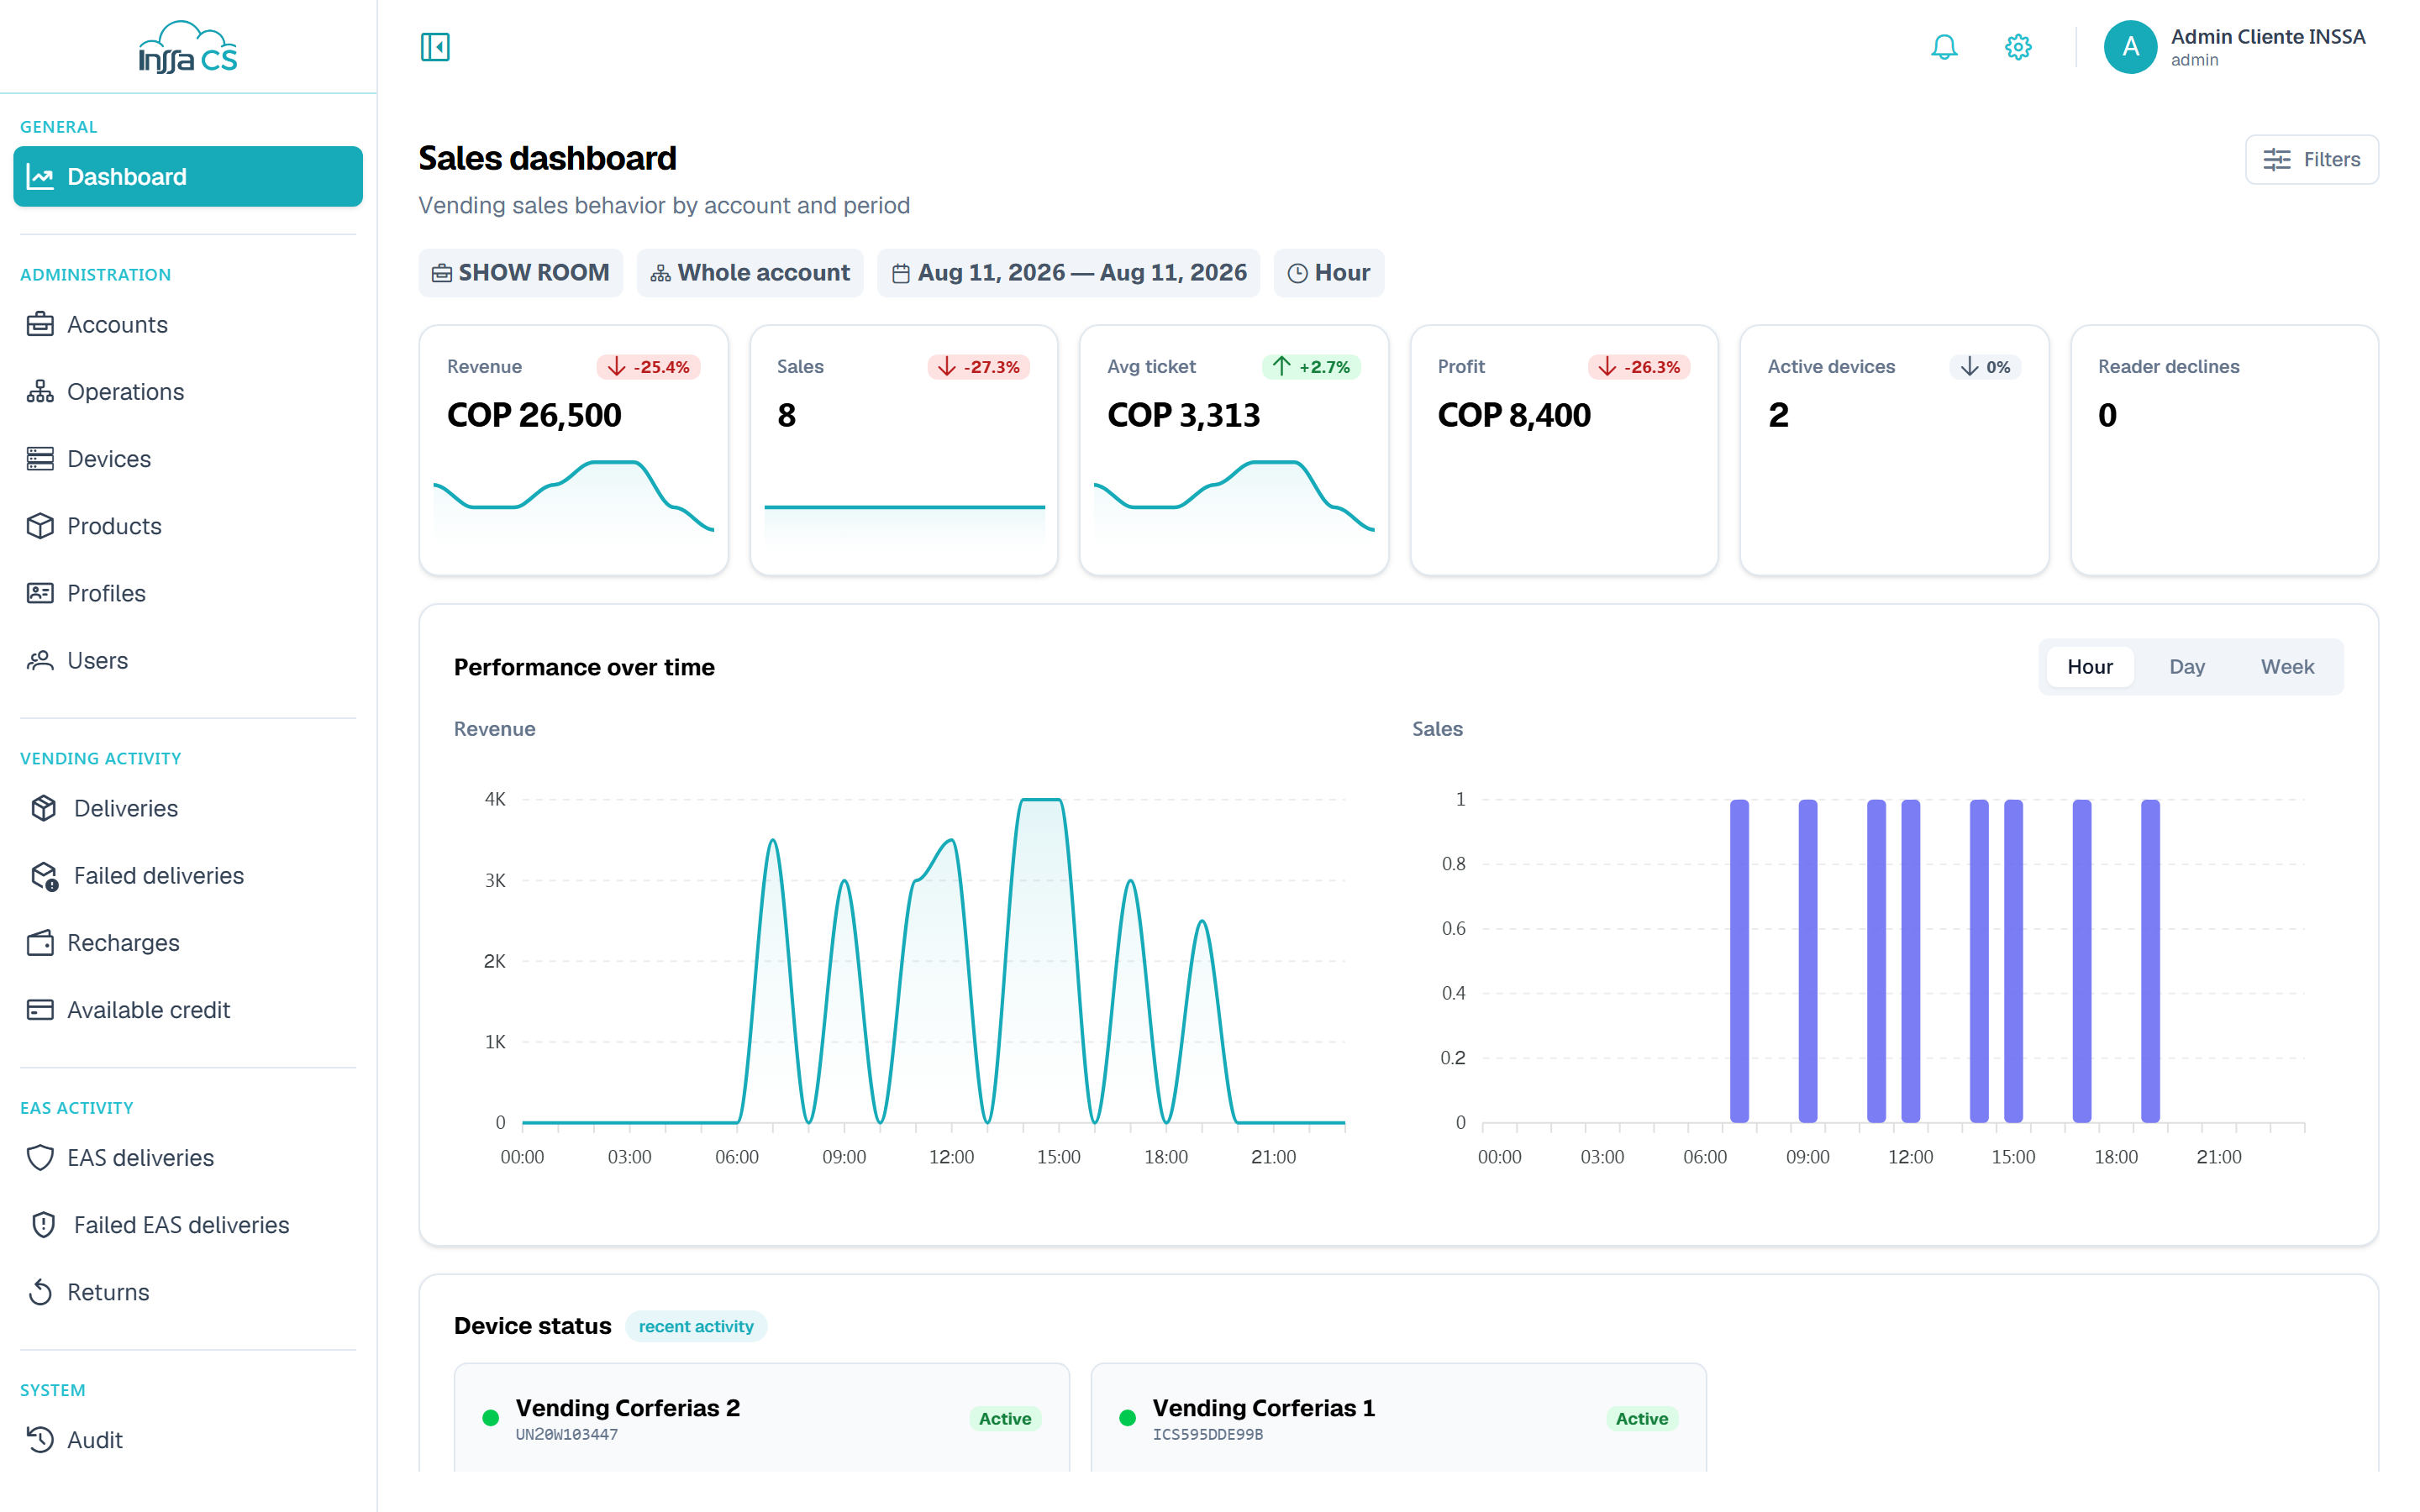
Filters
| Filter | Note |
|---|---|
| Account | Required: no account, no data. |
| Operation | Optional: Whole account or a specific operation. |
| Date range | Period to analyse. |
| Grouping | Hour · Day · Week. |
Choose and press Apply. Until then you see Pick an account and a date range, then apply to see the indicators.
KPIs
| KPI | What it measures |
|---|---|
| Revenue | Total value sold in the period. |
| Sales | Number of charged deliveries. |
| Average ticket | Revenue ÷ sales. |
| Profit | Revenue minus the cost of products sold. |
| Active devices | Machines with sales in the period. |
| Reader declines | Payment attempts declined by the reader. |
Each KPI is compared with the equivalent previous period; without enough history it shows No previous period.
Charts
- Revenue over time: trend at the chosen grouping.
- Performance over time: combined evolution of the period.
- Payment methods: split across cash, card, subsidy, wallet, etc.
- Sales by day and hour (heatmap): where consumption peaks.
- Products: units, revenue and margin per product.
- Devices: sales and revenue per machine.
Device status
Recent-activity block: last sale per machine, flagged Active or Idle. Useful to spot a machine that stopped selling.
From dashboard to detail
The dashboard answers what happened. For transaction-by-transaction detail go to Deliveries; to find out why something was rejected, to Failed deliveries.